If you’re thinking about selling your home (or even if you just want to keep up with the market), it's important to have a good understanding of what’s going on in the Bay Head and Mantoloking market. Inventory in both towns remains limited, but even more so in Bay Head, with only 3 active listings on the market (and 8 in Mantoloking). Recently, one oceanfront home went under contract in Mantoloking, and we had two closings on Osborne Avenue in B ay Head. Knowing the most important data such as the average sales price, the number of homes sold, and days on market will help you to better track the pulse of the market.
Our May market update showcases everything you need to know about local real estate trends. Note that we are now providing town statistics in a new format. The number before the slash (/) is for Bay Head, the number after the slash is for Mantoloking. This way, we can provide you with more detailed information. NOTE: You may see that some numbers are marked 0 or NA - per the MLS there is no data for that statistic for this time period - eg - no closings, or no new listings.
Statistics are per the Monmouth/Ocean MLS as of 5/18/22, and are provided for the month just concluded.

$1,236,333 / $3,585,000
Average Sales Price

.83/6.4
Months of Supply

66.3/N/A
Average Days on Market
Homes Sold
112.9/N/A
Sale-to-List Price
1/3
New Listings
2/8
Active Listings
1/2
Under Contract
3/1
Closed Sales
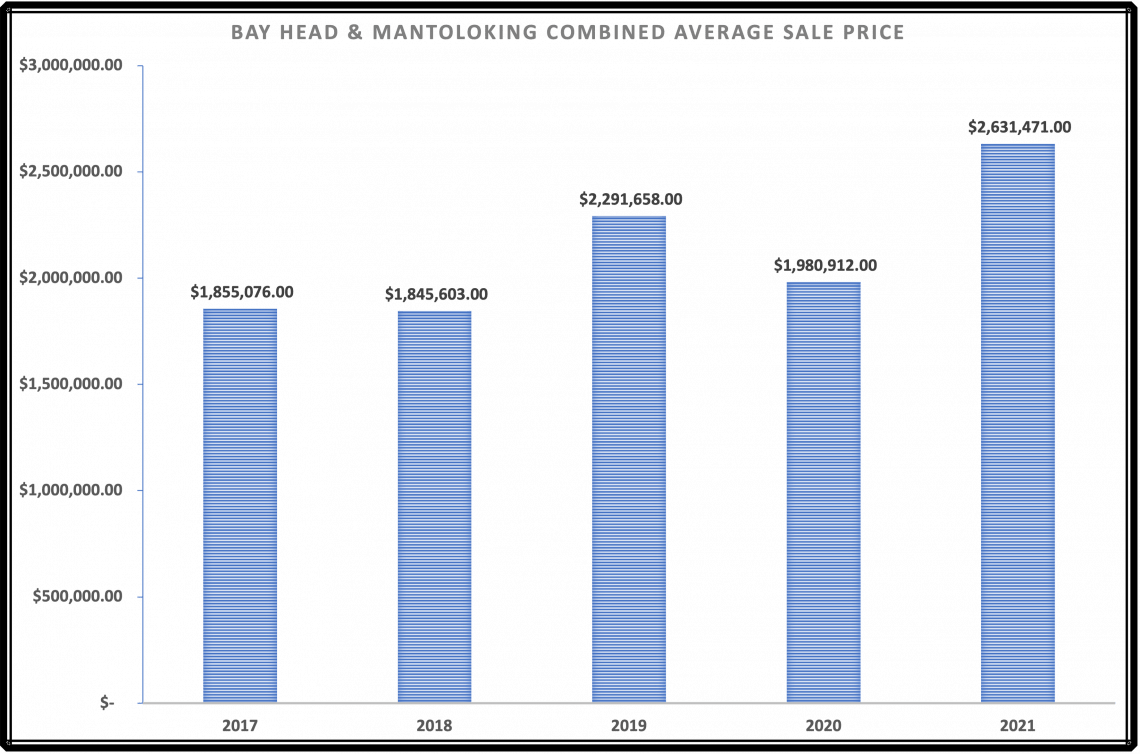
The Combined Average Sale Price for Bay Head & Mantoloking Over the Past Five Years
Sale prices in Bay Head and Mantoloking have remained steady or climbed in the past five years, and have rarely decreased. In our professional opinion, now is a good time to sell. We would be happy to meet with you to discuss your options in confidence.